Integrated live video and data analysis on the bench
Swansea City chooses SBG for Low-Latency Video and Live Data Analysis
–> Click here to enquire and speak to the team about SBG’s platform.
The Swans had a strong finish to the 2019/ 20 season reaching the EFL Championship play-off semi-finals under their new manager, Steve Cooper, and have continued that form into the new season.
The club has seen a lot of changes over the last couple of years including significant upgrades to their performance analysis department lead by Steve Rands. When Rands came to Swansea in 2019 he wasted no time in bringing in SBG, a system he has relied on since his time at Manchester City under Pep Guardiola when challenging for the title and competing in multiple competitions.
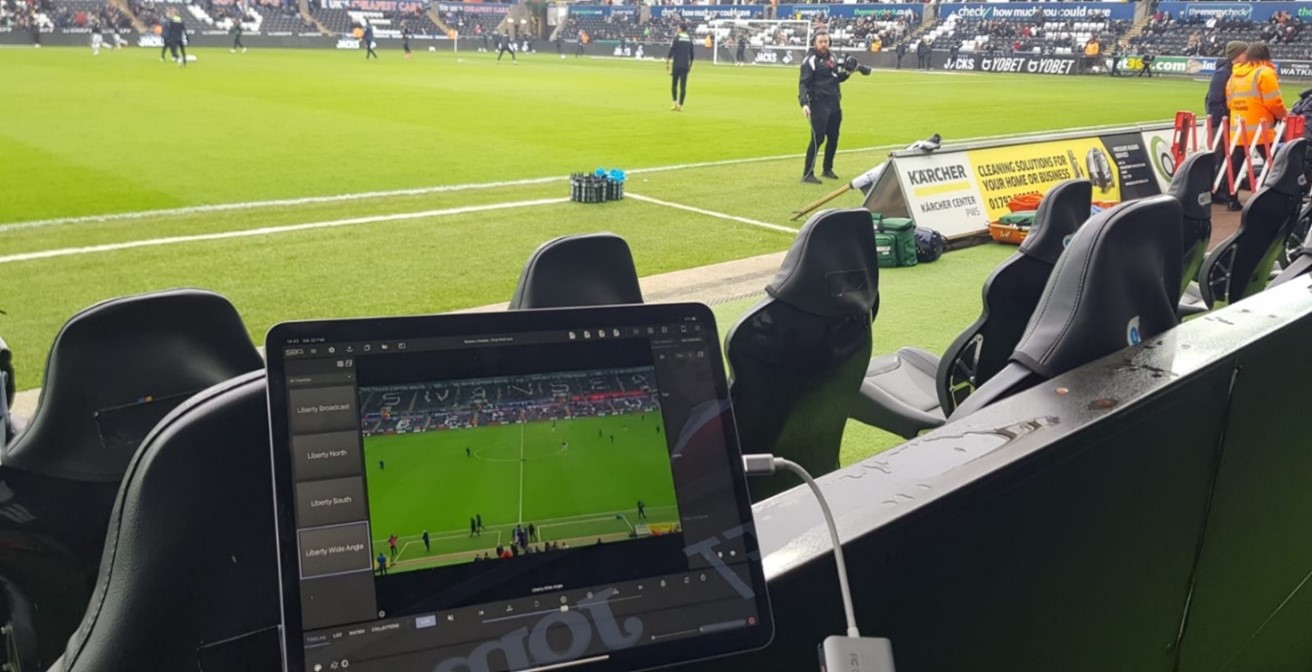
This past season Rands has been intent on streamlining the Swans’ analysis workflows to better implement Cooper’s football philosophy. One of his primary targets has been to update the in-game setup and bring multiple angle video access to the bench. While this is now commonplace in the Premier League, Rands wanted to ensure the coaches have all the best tools to exploit fine margins and make quick decisions. He set about providing all his staff with tablet devices running Focus, an app which streams video at low latency, allowing them to review key events in the game from every available angle.

–> Click here to learn more about Pro Video Analysis.
“Focus has added an extra dimension to our matchday analysis. Previously we were limited to radio communication with the coaches on the bench, but now we can maximise our resources by using tablet devices on the touchline. This has proven to be vital for us in the early moments of the game when identifying the opponent’s systems of play, formations and set pieces set ups. We organise video clips into presentations with notes and telestrations which the coaching staff review on their devices and present to the players at half time. At the end of the match we are in a position to share our analysis with the full game’s data and footage, and have it ready for the players to evaluate on the journey home,” says Steve Rands.
Tactically, analysts and coaches can share video clips, tag important events and create quick presentations which can be instantly accessed from any location such as the bench, analyst position or changing rooms on any Windows or Apple device.

Automated analysis to deliver key insights
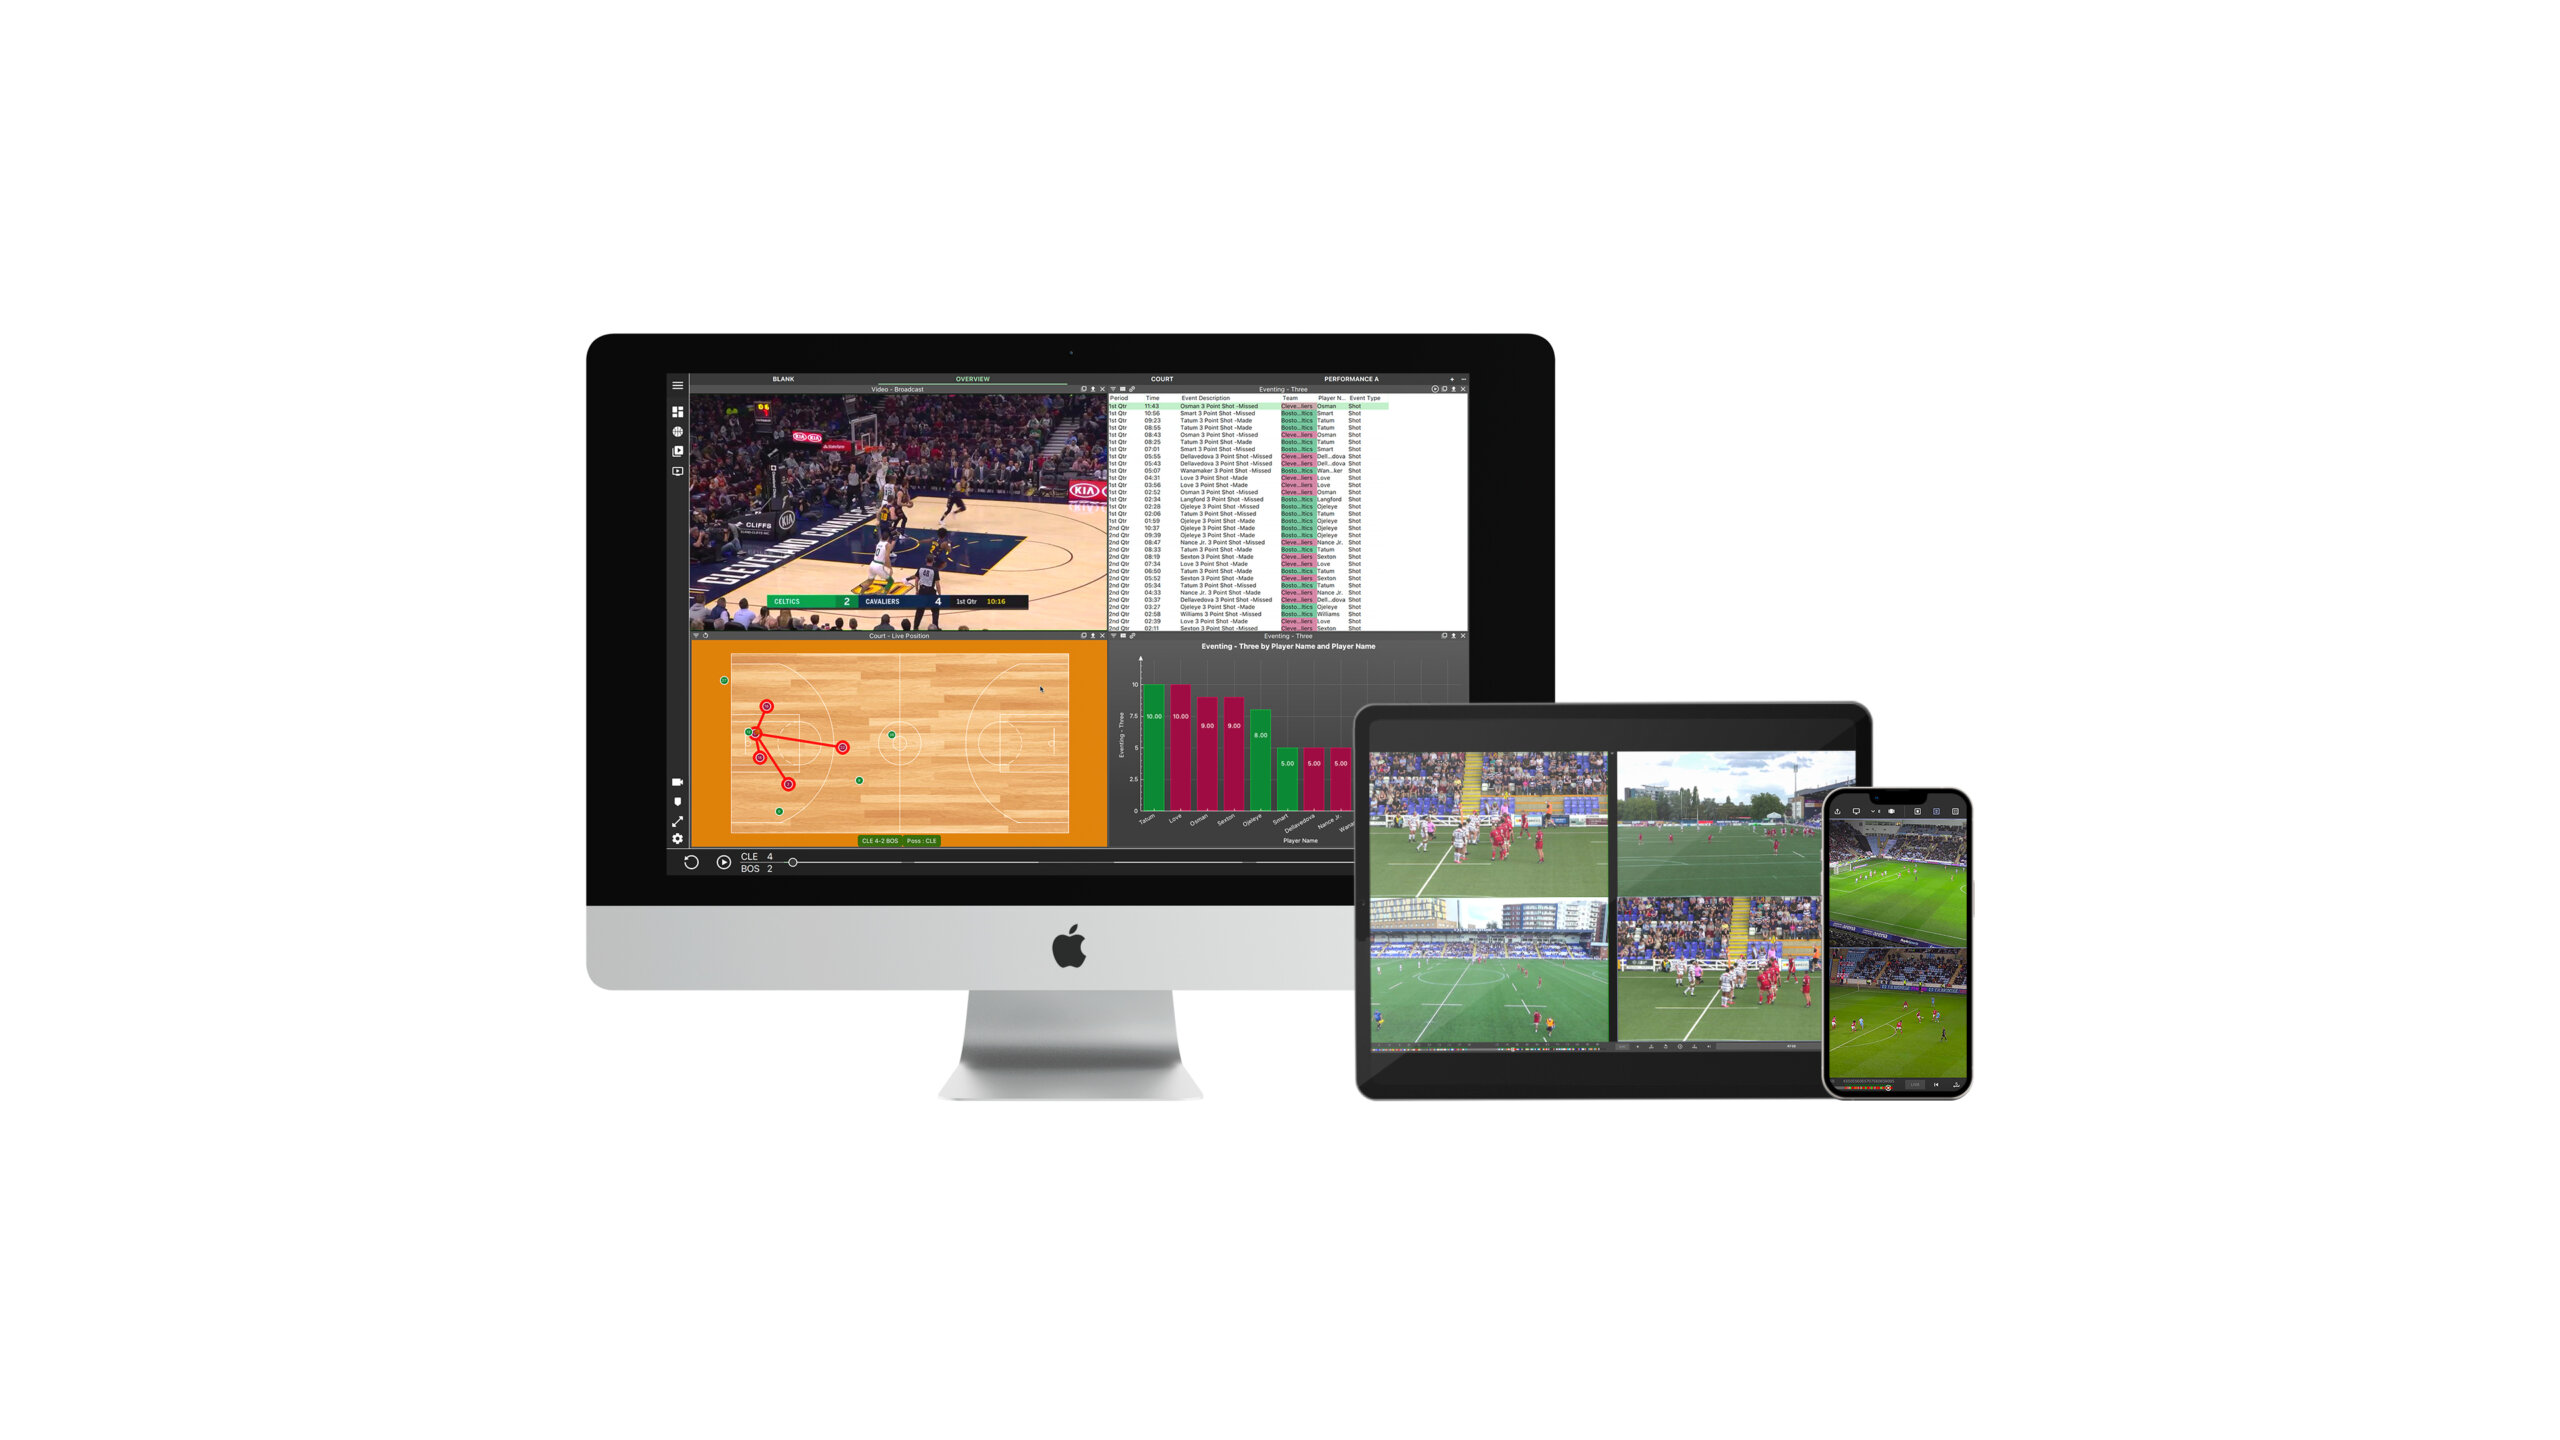
Integrating multiple data sources with video takes analysis to the next level. The deployment of MatchTracker by Swansea City has fully automated the vast majority of time-intensive manual data collection tasks.

In the opposition analysis process for example, we can analyse dozens of games for an upcoming opponent in much shorter periods of time, increasing our sample size and in turn the reliability of our outputs. What’s more, with less time spent collecting data, we are able to invest more into interpreting the data and delivering key insights.
MatchTracker covers all aspects of the game, from contextualising the physical side with tactical and game state information, to examining team and individual performance.
Analysts can customize their dashboards and create templates for report generation, using an array of data tables, deep filters and visualization options. They have the ability to setup alerts to deliver hundreds of new KPI’s for game moments not tied to events, such as opportunities between the lines or runs in behind, as well as in- and out-of- possession with the ball and off the ball. This frees the analysts to focus more on adding their expertise to the scouting reports and preparing for the next game.
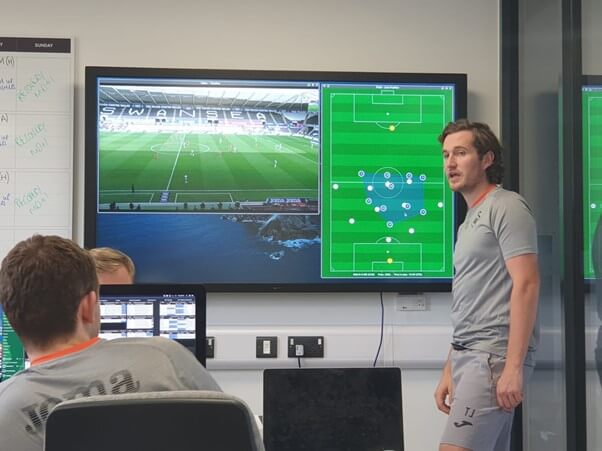
“MatchTracker has enabled us to get the most out of our eventing and tracking data like no other software has been able to. By visualising the data, linking it to video and integrating it within our opposition analysis and post-match processes we get the context we need to make informed decisions. It also helps us to automate a lot of our tagging which means we have more time to spend on detailed preparation, and delivering our insights to players and coaches. In the Championship this is particularly crucial as we play twice each week for most of the season,” comments Tom Jenkinson.

Matchday analysis with MatchTracker Live
On matchdays the coaching staff on the bench are reviewing key match events with all video angles on their Focus tablet timeline, enhanced by live event and tracking data delivered by MatchTracker Live.
“We set up our workbooks as usual in MatchTracker and as the data comes through from the providers the workbooks instantly begin to populate. We have access to live video streams alongside the real-time data and the great thing is that the Live version works in exactly the same way as the pre- and post-match analysis process, you just need to be connected to the live data source and server,” explains Rands.

Typically, live matchday workbooks revolve around specific key performance indicators which are monitored through data tables and charts, with all users connected to the same stream. This lets the coaches tag events they want to discuss at half time and allows the analysts to send in-game clips and messages.
As soon as the game is finished, the video and data can be packaged up and distributed to the coaching staff and players via a MatchTracker Package or an SBG Hub upload.
To keep workflows collaborative, videos, reports, presentations, data, and databases are collected and stored ready to be used and filtered in long-term trend analyses.